USDA Supply & Demand Review - April 2023
Take a Free Trial of our Daily Comments, Weekly Market Letter and more! Subscribe today or Learn More
Soybeans
US soybean ending stocks for 2022/23 came in at 210 million bushels versus an average expectation of 199 million and a range of expectations from 170 to 225 million. This was unchanged from the March report. In fact, all the numbers for the US were unchanged from March. World ending stocks came in at 100.29 million tonnes versus 98.6 million expected (range 96.5-101.9 million) and 100.0 million in March. Brazilian production came in at 154.00 million tonnes versus 153.5 million expected (range 151.00-157.7 million) and 153.00 million in March. Argentine production came in at 27.00 million tonnes versus 29.2 million expected (range 25-32 million) and 33.00 million in March.
PRICE OUTLOOK
The market fell after the report was released, as the USDA made no changes to the US data, leaving the stocks/usage ratio unchanged from March versus fears that we would end up with the second tightest stocks/usage on record. A jump in Brazilian production partially offset the sharp drop in Argentine production. China’s crush was adjusted lower to 91 million tonnes, down 1 million from the March report.

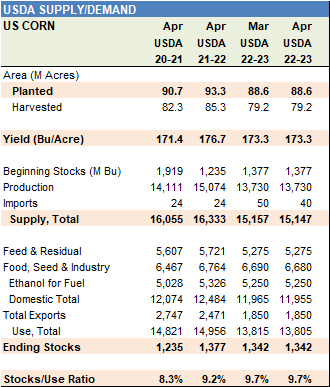
Corn
US corn ending stocks for 2022/23 came in at 1.342 billion bushels versus an average trade expectation of 1.322 billion and a range of expectations from 1.242 to 1.392 billion. This was unchanged from the March report. World ending stocks came in at 295.35 million tonnes versus 295.2 million expected (range 291.7-299.5) and 296.5 million in March. Brazilian production came in at 125 million tonnes versus 126 million expected (range 123.0-131.3 million) and unchanged from March. Argentine production came in at 37.00 million tonnes versus 37.1 million expected (range 33-39 million) and 40.0 million in March.
PRICE OUTLOOK
The market traded lower after the report, as fears that old crop supply would tighten were alleviated with no major changes in the US data except for minor adjustments in imports and industrial usage that offset each other to hold ending stocks unchanged. World data came in about as expected, and the report failed to give reason for longs to buy more. July Corn support is at 621 ½ and 615 ½. If support is violated, sellers could get more active. December Corn support is at 555 ½, and a close below that level would leave 536 ½ as the next downside target.
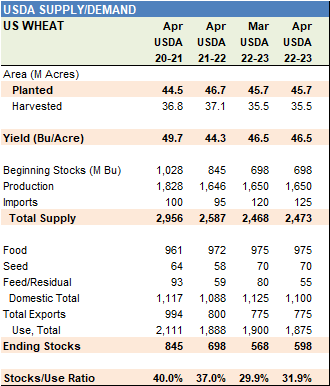
Wheat
US 2022/23 wheat ending stocks came in at 598 million bushels versus an average trade expectation of 577 million and a range of expectations from 553 to 616. This was up from 568 million in the March report. World ending stocks came in at 265.05 million tonnes versus 267.1 million expected (range 265.5-269.0 million) and 267.20 million in March.
PRICE OUTLOOK
The USDA news was mixed, as US ending stocks jumped well above trade expectations but world ending stocks came in below the low end of the range of expectations. World demand was adjusted higher by nearly 3 million tonnes, and this helped tighten world stocks.